


How to Research a Stock in Your DEGIRO Portfolio
In Invest Tracker you can open every stock in your portfolio with the arrow at the end of its row. You then see a candlestick chart with your own buys and sells, today's price movement, key figures such as the P/E ratio and the next earnings date, and the latest news, with an optional AI summary. Everything in one place, without switching between DEGIRO and a dozen websites.
Step-by-step
Step 1: Upload your DEGIRO CSV
Export your account statement as a CSV (how to export it) and drop it into Invest Tracker.
Step 2: Open a stock
In Current Holdings, click the arrow at the end of a row. You can also click a stock in the Today box, or open a position you already sold in Sold Positions. Click the arrow again to close it.
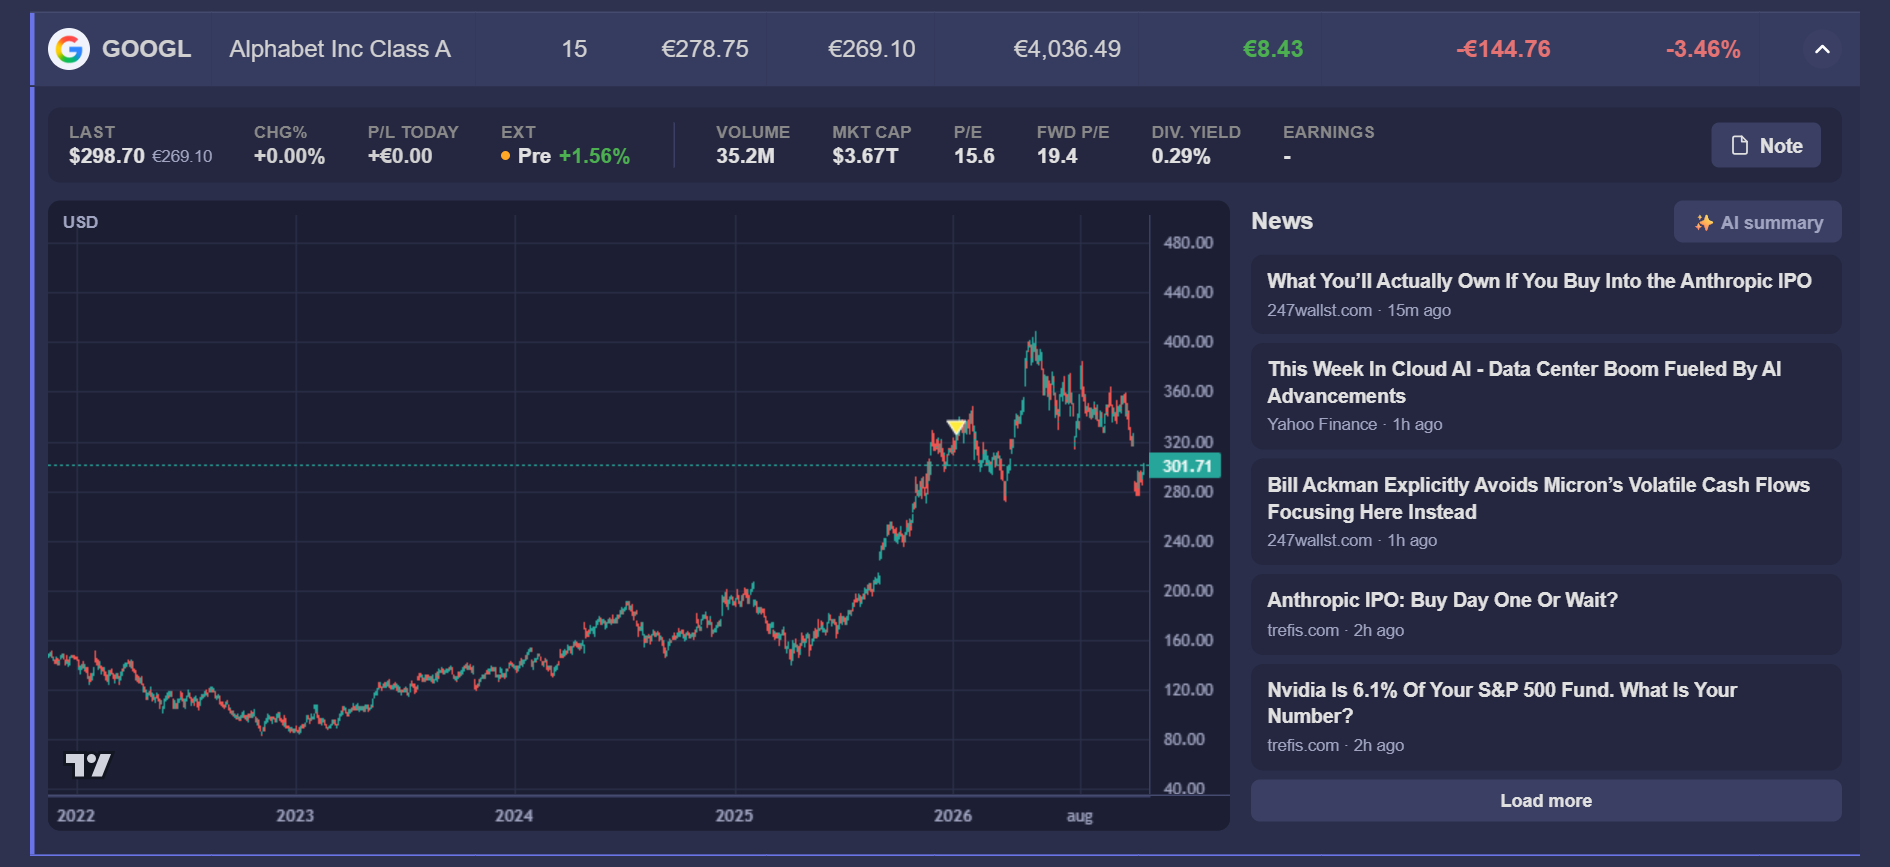
What you see
- Price and today's change, including pre-market and after-hours movement, updated live during trading hours.
- Key figures: trading volume, market cap, P/E, forward P/E, dividend yield and the date of the next earnings report.
- A candlestick chart of the last five years. Scroll to zoom in and drag to move through time. Yellow triangles mark your buys and red triangles your sells, so you see at a glance whether you bought at a good moment.
- The latest news about the company. Click an article to read it in a popup.
- ✨ AI summary: a short summary of the latest news and why the stock is moving. This needs a free account; you can use it a few times a day.
- Note: write down why you bought the stock, so you can check later whether your reasons still hold (free account).
Follow stocks you don't own: the watchlist
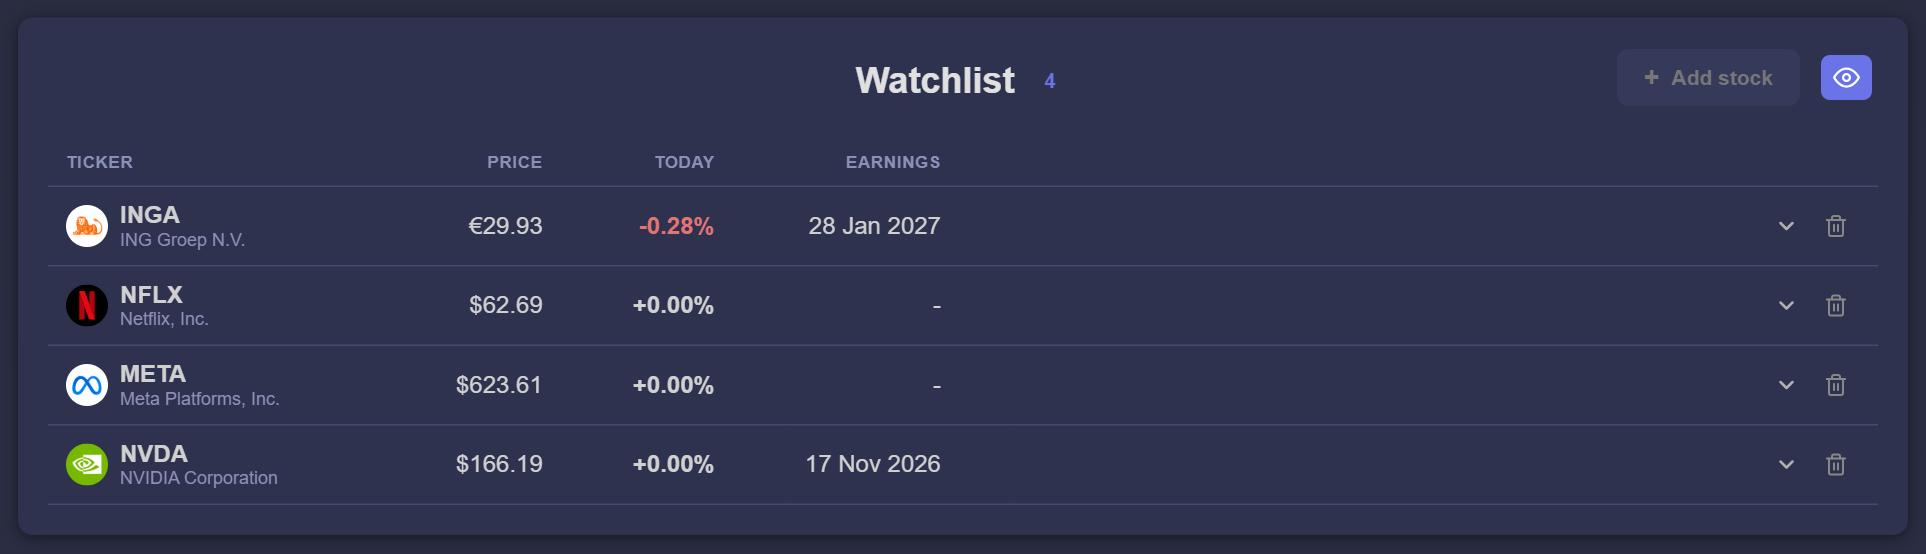
With a free account you can add up to 30 stocks to your Watchlist, for example companies you are thinking of buying. They show their live price, today's change and the next earnings date, and open in the same detail view. Watchlist stocks are kept separate from your portfolio, so they never affect your profit or portfolio value. For a position you sold, the Watch button in the detail view adds it to your watchlist in one click.
Open your own stocks
Free and no account required. Without an account, your data stays in your browser.
Upload your DEGIRO CSVFrequently asked
Where do the prices, news and key figures come from?
Prices, news and key figures come from public market data (Yahoo Finance). Key figures are refreshed once a day; prices update live while the market is open.
Does the detail view work on my phone?
The detail view with chart and news is made for larger screens and is available on a tablet or computer. On a phone you keep the compact overview of your positions.
Invest Tracker is an independent tool and is not affiliated with DEGIRO. Prices, news, key figures and AI summaries come from third-party sources, may be delayed or inaccurate, and are for information only, not financial advice.